You can use the app by either clicking on your location directly on the map or by entering geographical coordinates into the box above the map, and then clicking on submit.
1. Using the map
The map is simple to use. Move the map by clicking and dragging or touching the map if on mobile.
Zoom in with the + and – buttons or by using the scroll wheel, or by pinching if on mobile. There is a search function on the map, represented by the magnifying glass button. Clicking on it allows you to search for a location, and pressing enter or tapping the search term on mobile will bring you to that location. Note that searching for a location only brings you to that location, it does not refresh the DLI values for that location.
2. Generating a report
Once DLI values have been generated, an option appears to download a PDF report. This will output your results into a PDF file for your convenience. DLI values will be shown on the right, and your chosen location will be pinned to a map.
3. Downloading the data
Once DLI values have been generated, an option appears to download a comma separated values (CSV) file. This file contains the following information:
Q1: first quartile or 25th percentile of the DLI values for a particular month.
Q3: third quartile or 75th percentile of the DLI values for a particular month.
dli_val: the average daily light integral for a particular month.
interpolated: a true or false value indicating whether this DLI has had missing satellite data at this particular location, and the data was interpolated using the closest ground stations.
month: the month of this particular average DLI.
range: the range which this DLI value falls within.
warning: a true or false value indicating whether a warning was given upon retrieving the DLI values.
4. Toggle Stations
This button allows you to see all of the 2,000+ World Meteorological Organization (WMO) weather stations located around the world, represented by blue circles.
5. Geographic Coordinates
Note that latitude is positive in the northern hemisphere, and negative in the southern hemisphere. Longitude is positive east of the prime meridian, and negative west of the prime meridian.
Coordinates must be entered as latitude and longitude in decimal form. For example, Victoria, Canada would be entered as “48.42, -123.36”.
If you have coordinates available in degrees / minutes / seconds (DMS) form, you can convert them to decimal form using the formula:
Decimal degrees = degrees + (minutes/60) + (seconds/3600)
For example, if you have:
48° 25′ 42.3” N
123° 21′ 56.3” W
these become:
48 + (25/60) + (42.3/3600) = 48.42
-123 + (-21/60) + (-56.3/3600) = -123.36
You can also use an online coordinate converter, such as: https://www.pgc.umn.edu/apps/convert/.
Alternatively, simply zooming in as necessary and clicking on the map will show your latitude and longitude coordinates in the input box in decimal form.
CAUTION: If there are no weather stations located with 100 km of the chosen location and there is missing satellite data for that location, the predicted DLI values may not be accurate. The app will warn you if this is the case.
6. DLI Map Colors
An option to show DLI colors on the interactive map is displayed. You can see a visualization of the DLI values for the entire Earth for a given month with a click of a button. DLI colors can be toggled off and on by clicking the button. Once the colors are displayed, you can specify the month by using the month selector.
Greenhouses
The DLI values given by this app correspond to the amount of light received outdoors for a particular location. To estimate the DLI values inside your greenhouse, carry out the following:
- Measure light intensity outdoors at noon on a clear day using a photometer.
- Measure light intensity in your greenhouse at noon on a clear day using a photometer.
- Calculate the percentage of light that is transmitted to your greenhouse by dividing your value obtained in Step 2 by the value obtained in step 1.
- Multiply DLI values by that percentage calculated in step 3 to obtain your DLI values inside your greenhouse.
Example: Say we calculate 1500 lux outside and 750 lux inside a greenhouse. Then our value for step 3 is 750/1500= 0.5. Now we simply multiply every DLI value outputted for our location by 0.5 to get the DLI values for the inside of our greenhouse.
Show Interquartile Range (IQR)
On clicking the “show IQR” button, interquartile ranges for the displayed DLI values appear. The interquartile range is a metric that describes statistical dispersion. In other words, how much the data is spread out. The IQR is written in terms of percentiles. Percentiles are data points where a certain percent of the data is less than that data point. For example, the 20th percentile is the data point where 20 percent of the data is less than that data point. In an IQR, we have the 25th percentile and the 75th percentile, labeled Q1 and Q3 respectively. The IQR is what data lies between the 75th percentile and the 25th percentile, in other words where 50 percent of the data lies in the dataset. This gives us an idea of how much variation there is in the data used to calculate DLI values with the DLI Calculator. The average DLI is given first, then the IQR tells us what other DLI values we can expect to see as well. The IQR calculation only uses ground station data (not satellite data). Results may vary.
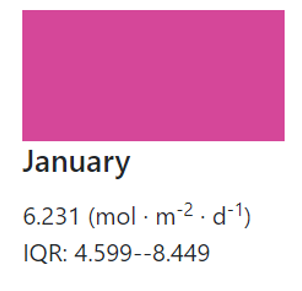
Example: The average DLI value for the month of January is calculated to be
6.231 (mol * m-2 * d-1). The interquartile range is 4.599 (mol * m-2 * d-1) to 8.449 (mol * m-2 * d-1) where 4.599 is Q1 and 8.449 is Q3 respectively. This information would be displayed as below. So, 50 percent of the DLI values in January lie between 4.599 and 8.449 (mol * m-2 * d-1).
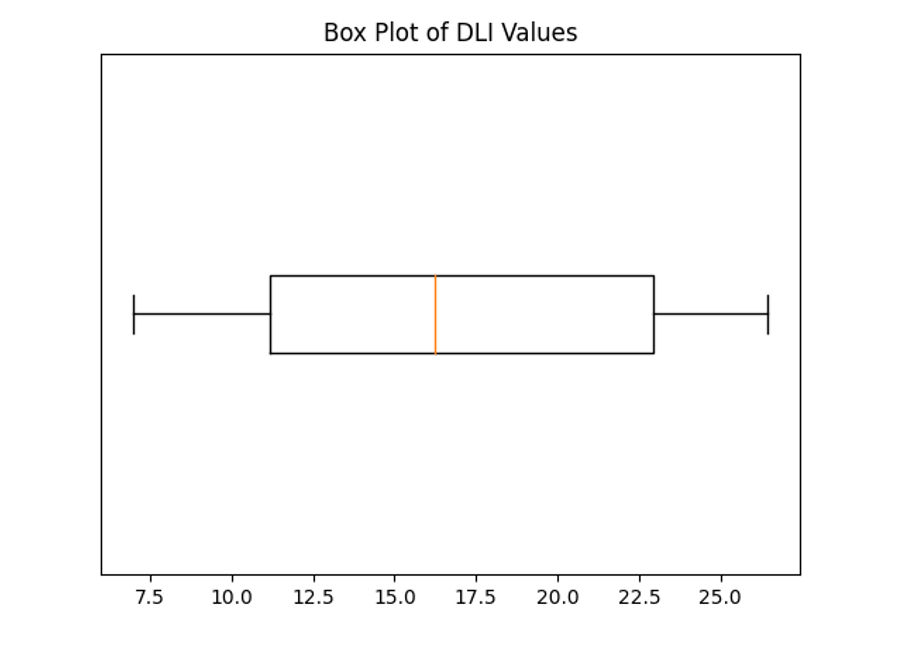
To visualize the IQR, a box plot is used. This is commonly known as a box and whiskers plot. See the example box plot. A sample weather station’s DLI values for one month have been plotted on a box plot. We can see that the IQR is between 11 and 22.5, the “minimum” is 7.5, the median is around 16, and the “maximum” is around 27.

Fig. 1 – DLI Calculator
[1] Faust, J. E., and J. Logan. 2018. “Daily Light Integral: A Research Review and High-resolution Maps of the United States,” HortScience 53(9):1250-1257.

Fig. 2 – DLI Calculator
[2] It is important to remember that the amount of light incident upon the plant canopy in a greenhouse may be between roughly 40 and 60 percent of the amount of light incident on an open field adjacent to the greenhouse. The actual values depend on the glazing transmittance, the greenhouse roof design, the building orientation, whether the glazing is transparent or translucent, the amount of cloud cover, and more. SunTracker Technologies’ Cerise365 + Greenhouse Designer can calculate accurate DLI values inside greenhouses, hybrid vertical farms, and building atria.